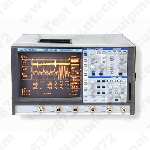
LeCroy 9314M
4-Ch,300MHz,100MS/s,50k,Digital Oscilloscope
Contact us for pricing and availability.
Description
- Features:
- 10K, 50K, and 1M Word Records
- Glitch, interval, window, dropout, TV and sate qualified triggers
- Automatic PASS / FAIL testing
- Programmable over the GPIB and RS232
- Persistance, XY and roll modes
- Advanced signal processing
- Four channels
The LeCroy 9314M oscilloscope is a graph-displaying device “ it draws a graph of an electrical signal. In most applications, the graph shows how signals change over time: the vertical (Y) axis represents voltage and the horizontal (X) axis represents time. The intensity or brightness of the display is sometimes called the Z axis.
The LeCroy 9314M oscilloscope's simple graph can tell you many things about a signal, such as: the time and voltage values of a signal, the frequency of an oscillating signal, the œmoving parts쳌 of a circuit represented by the signal, the frequency with which a particular portion of the signal is occurring relative to, other portions, whether
Specifications & Attributes (Oscilloscopes)
| Form Factor |
|---|
| Benchtop |
| Portable |
| Bandwidth |
|---|
| 300 Mhz |
| Channels |
|---|
| 4 Ch |
| Sample Rate |
|---|
| 100 MS/s |
| Type |
|---|
| Digital |